Using Kokkos with ROCm Profiling Tools
Posted on January 28, 2026 • 7 min read • 1,488 words
Optimizing HPC applications for GPUs can be a challenge, and AMD’s GPUs are no exception.
AMD provides performance profiling and understanding tools with its ROCm GPU programming environment.
This post demonstrates how to use ROCm’s profiling tools with Kokkos applications, specifically focusing on rocprof-sys (formerly Omnitrace) and rocprof-compute to analyze a simple GEMM implementation and compare it against the one provided by rocBLAS.
Setting Up the Environment
This example was carried out on Sandia’s El Dorado system, which is similar to El Capitan. We preserve a fair amount of detail here for completeness - you may need to substitute your own environment details where appropriate.
First, retrieve Kokkos and Kokkos Kernels. Kokkos Kernels provides an interface to ROCm’s math libraries for the Kokkos ecosystem. The specific versions of these two libraries doesn’t matter as long as they support the ROCm you have available.
git clone --branch 5.0.0 https://github.com/kokkos/kokkos.git

git clone --branch 5.0.0 https://github.com/kokkos/kokkos-kernels.git
Building Kokkos and Kokkos Kernels
After allocating a compute node and loading the ROCm module, we’ll build Kokkos and Kokkos Kernels
salloc -N 1 -p pbatch

# Load ROCm (6.4.3 beta 2 at time of writing)
module load rocm/6.4.3beta2
export CRAYPE_LINK_TYPE=dynamic

# Configure Kokkos, targeting the correct AMD GPU architecture.
cmake -S kokkos -B build-kokkos \
  -DCMAKE_BUILD_TYPE=Release \
  -DCMAKE_CXX_COMPILER=hipcc \
  -DCMAKE_INSTALL_PREFIX=install-kokkos \
  -DKokkos_ENABLE_HIP=ON \
  -DKokkos_ARCH_AMD_GFX942_APU=ON

# Build and install Kokkos
cmake --build build-kokkos --target install --parallel $(nproc)

# Configure Kokkos Kernels
cmake -S kokkos-kernels -B build-kokkos-kernels \
  -DCMAKE_BUILD_TYPE=Release \
  -DCMAKE_CXX_COMPILER=hipcc \
  -DCMAKE_INSTALL_PREFIX=install-kokkos-kernels \
  -DKokkos_ROOT=install-kokkos \
  -DKokkosKernels_ENABLE_ALL_COMPONENTS=OFF \
  -DKokkosKernels_ENABLE_COMPONENT_BLAS=ON \
  -DTPL_ENABLE_ROCBLAS=ON

# Build Kokkos Kernels
cmake --build build-kokkos-kernels --target install --parallel $(nproc)
During Kokkos Kernels configuration, verify that rocBLAS is detected:
Kokkos Kernels TPLs
   ROCBLAS:     /opt/rocm-6.4.3beta2/lib/librocblas.so
The Example Application
The example application provides two GEMM implementations:
// Naive GEMM, written using Kokkos MDRange policy
template <typename ViewType>
void gemm_naive(const ViewType& C, const ViewType& A, const ViewType& B) {
    const int M = A.extent(0);
    const int N = B.extent(1);
    const int K = A.extent(1);

    Kokkos::parallel_for("gemm_naive",
        Kokkos::MDRangePolicy{{0, 0}, {M, N}},
        KOKKOS_LAMBDA(const int i, const int j) {
            double sum = 0.0;
            for (int k = 0; k < K; ++k) {
                sum += A(i, k) * B(k, j);
            }
            C(i, j) = sum;
        });
}

// rocBLAS GEMM via Kokkos Kernels
template <typename ViewType>
void gemm_kk(const ViewType& C, const ViewType& A, const ViewType& B) {
    KokkosBlas::gemm("N", "N", 1, A, B, 0, C);
}
It creates synthetic data for these, and then times how long they take.
Build the examples:
cmake -S example -B build \
  -DCMAKE_CXX_COMPILER=hipcc \
  -DCMAKE_BUILD_TYPE=Release \
  -DKokkos_ROOT=install-kokkos \
  -DKokkosKernels_ROOT=install-kokkos-kernels

cmake --build build
Profiling with rocprof-sys
The rocprofv3 tool provides comprehensive system-level profiling: understanding what the CPU and GPU are executing, when they’re executing it, and how long that execution takes.
Documentation is available at rocm.docs.amd.com.
Rocprof is aware of the Kokkos profiling interface, and provides its own implementation of the required callbacks.
This means you don’t need to have Kokkos Tools available to surface Kokkos information in Rocprof.
Use rocprofv3 to profile your application with Kokkos hooks enabled:
HSA_XNACK=1 \
rocprofv3 --runtime-trace --output-format pftrace --kokkos-trace -- build/gemm
The key flags are:
--runtime-trace: Collect tracing data for HIP runtime API, Marker (ROCTx) API, RCCL API, ROCDecode API, Memory operations (copies, scratch, and allocation), and Kernel dispatches.--output-format pftrace: Create a perfetto trace--kokkos-trace: Enable Kokkos profiling hooks
This saves the perfetto trace in <hostname>/<PID>_results.pftrace.
On El Dorado, the naive implementation took 1.26 seconds while the rocBLAS version via Kokkos Kernels completed in just 0.025 seconds—a 63x speedup!
Visualizing System Activity with Perfetto
rocprofv3 creates a directory <hostname> containing the trace files. To visualize:
- Copy the
<hostname>/*.pftracefile to your local machine - Navigate to https://ui.perfetto.dev
- Open the trace file
- Use WASD keys to navigate (yes, like a video game!)
Pro tip: Pin important rows to the top for easier analysis.
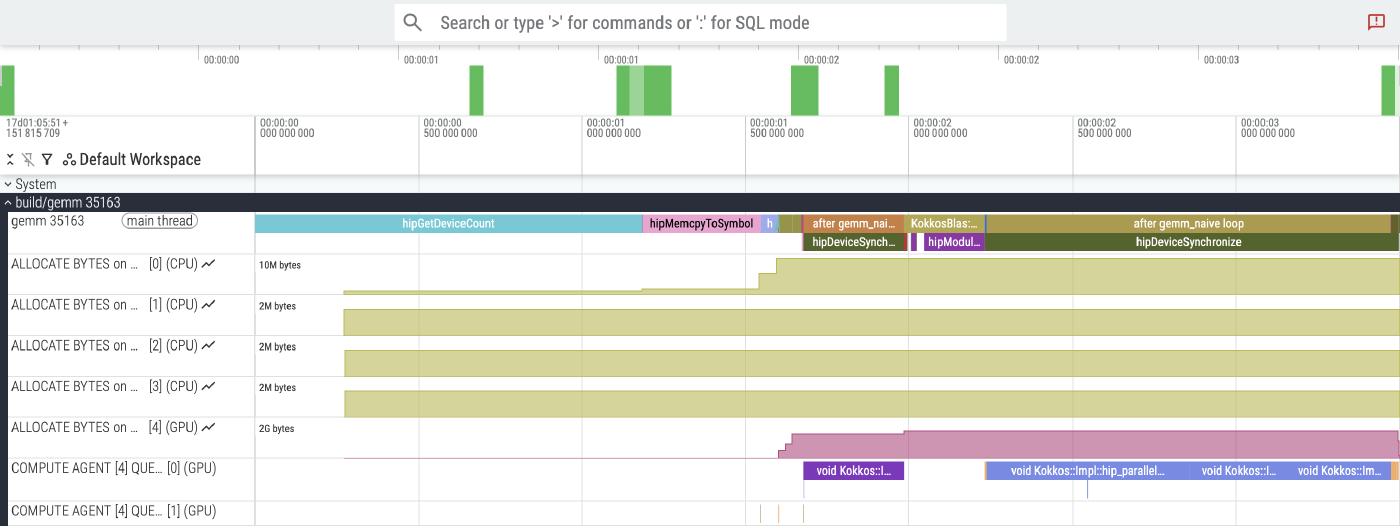
The screenshot above shows the Perfetto UI after loading the .proto trace file.
There are two rows, one labeled gemm 35163 with the binary name and process ID, and the other one a “HIP Activity” on a particular device and queue.
The --kokkos-trace flag on rocprofv3 tells rocprof to hook into the Kokkos profiling interface, so we can see that the top row has spans annotated with useful labels.
The left half of the figure is various parts of Kokkos initialization, plus two GEMM executions to warm up.
We can actually use this trace to see why it is important to exclude these warm-ups from the timer.
The KokkosBlas::gemm call is what wraps rocBLAS, and internally, its time is mostly consumed by a hipModuleLoadData call internal to rocBLAS.
This call takes 223 milliseconds the first time, but future rocBLAS calls do not invoke it, and happen much faster.
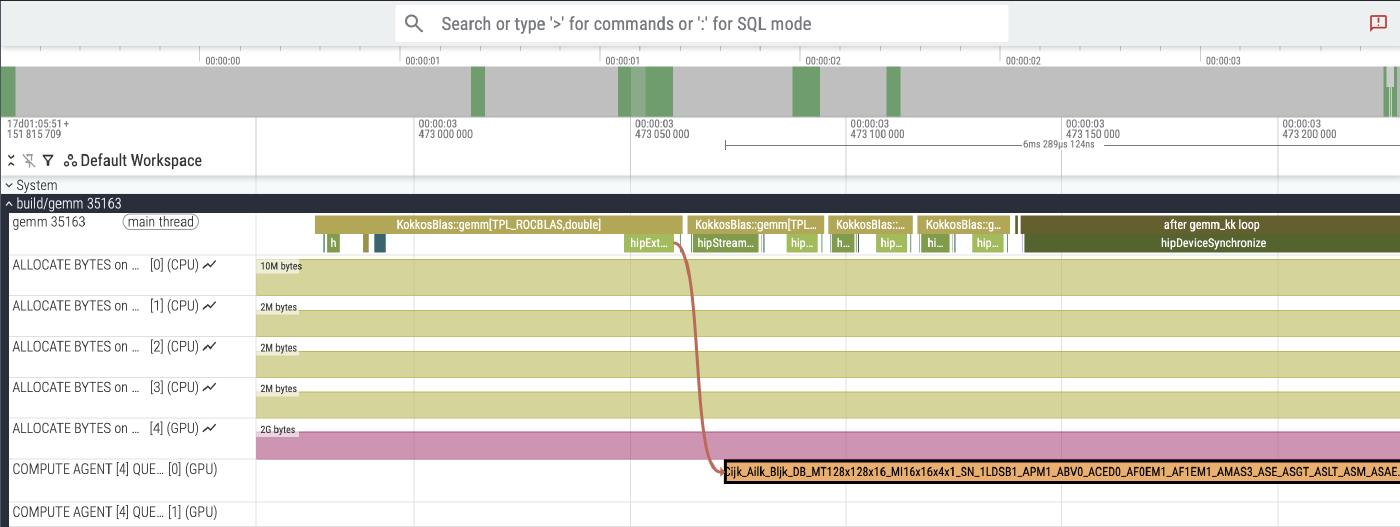
Here, we zoom in on a slice of the run time. This shows the four rocBLAS GEMMs that we time. There are no traces attached to the rocBLAS call itself, so they don’t appear - all we see are the instrumented Kokkos and HIP operations around them. On the first one, you can also see the correlation between the HIP runtime call to launch the rocBLAS kernel, and the actual GPU execution, connected by an arrow. Note that the GPU execution is asynchronous - while the first rocBLAS kernel is running, we continue to queue up three more.
Kernel Performance Analysis with rocprof-compute
The rocprof-compute tool provides kernel-level performance analysis similar to NVIDIA’s Nsight Compute.
Rather than the system-level insights provided by rocprofv3, rocprof-compute provides insight into why particular kernels perform the way they do.
Unlike rocprofv3, it expects to be run from a python environment with some dependencies installed.
Setting Up the Python Environment
I’m familiar with python virtual environments, and ROCm provides a list of dependencies that need to be installed. Other python environment managers can also be used.
python3 -m venv .venv
source .venv/bin/activate

# Install requirements
pip install -r $ROCM_PATH/libexec/rocprofiler-compute/requirements.txt
Profiling Specific Kernels
Usually you’ll be working with a limited number of kernels at a time while you’re investigating performance.
The -k flag filters kernels by name, while -n specifies the output directory name.
Results are stored in workloads/<name from -n>/<gpu>/.
Profile the naive GEMM implementation:
HSA_XNACK=1 \
rocprof-compute profile --no-roof -k gemm_naive -n gemm_naive -- build/gemm
Profile the rocBLAS kernel (identified by “Cijk” in the kernel name):
HSA_XNACK=1 \
rocprof-compute profile --no-roof -k Cijk -n gemm_kk -- build/gemm
Comparing the Naive Implementation with rocBLAS
ROCm provides an analysis tool to compare metrics across different runs.
To list available metrics:
rocprof-compute analyze -p workloads/gemm_naive/MI300A_A1 --list-metrics gfx942For our examples, we can compare the metrics for the naive implementation and rocBLAS like this:
rocprof-compute analyze -p workloads/gemm_naive/MI300A_A1/ -p workloads/gemm_kk/MI300A_A1/ > analyze.txtThis produces a file with a variety of tables for different kinds of metrics:
...
--------------------------------------------------------------------------------
2. System Speed-of-Light
2.1 Speed-of-Light
╒═════════════╤═══════════════════════════╤══════════╤═══════════════════════╤════════════╤══════════════════╤═══════════╤══════════════════╤═══════════════╤══════════════════╕
│ Metric_ID   │ Metric                    │ Avg      │ Avg                   │   Abs Diff │ Unit             │ Peak      │ Peak             │ Pct of Peak   │ Pct of Peak      │
╞═════════════╪═══════════════════════════╪══════════╪═══════════════════════╪════════════╪══════════════════╪═══════════╪══════════════════╪═══════════════╪══════════════════╡
│ 2.1.0       │ VALU FLOPs                │ 1654.05  │ 0.13 (-99.99%)        │   -1653.92 │ Gflop            │ 61286.4   │ 61286.4 (0.0%)   │ 2.7           │ 0.0 (-100.04%)   │
├─────────────┼───────────────────────────┼──────────┼───────────────────────┼────────────┼──────────────────┼───────────┼──────────────────┼───────────────┼──────────────────┤
│ 2.1.1       │ VALU IOPs                 │ 1659.56  │ 6.71 (-99.6%)         │   -1652.85 │ Giop             │ 61286.4   │ 61286.4 (0.0%)   │ 2.71          │ 0.01 (-99.71%)   │
├─────────────┼───────────────────────────┼──────────┼───────────────────────┼────────────┼──────────────────┼───────────┼──────────────────┼───────────────┼──────────────────┤
│ 2.1.2       │ MFMA FLOPs (BF16)         │ 0.0      │ 0.0 (0.0%)            │       0.00 │ Gflop            │ 1961164.8 │ 1961164.8 (0.0%) │ 0.0           │ 0.0 (0.0%)       │
...
The way to read this is that the pairs of columns (e.g., the two Avg columns) are for the two provided workloads.
The second column also includes how the number changes relative to the first.
You can scan down the columns and see where the biggest deltas are.
In the snippet above, we can see that the rocBLAS implementation basically doesn’t do any VALU FLOPS at all relative to the naive implementation.
Key Performance Differences
The analysis reveals striking differences between our naive implementation and rocBLAS:
| Metric | Naive | rocBLAS |
|---|---|---|
| Workgroups | 800,000 | 3,150 |
| Dispatched wavefronts | 800,000 | 12,600 |
| LDS Allocation | 0 B | 20,480 B |
| VALU Instructions | 14,447 | 222 |
| MFMA Instructions | 0 | 19,200 |
The rocBLAS implementation achieves superior performance through a combination of
- Using fewer workgroups
- Leveraging Local Data Share (LDS) memory for data reuse
- Utilizing specialized Matrix Fused Multiply-Add (MFMA) instructions
- Trading vector FP64 instructions for Matrix Fused Multiply-Add (MFMA) instructions
Conclusion
ROCm’s profiling tools provide powerful insights into GPU application performance.
The combination of rocprofv3 for system-level tracing and rocprof-compute for detailed kernel analysis enables developers to identify optimization opportunities effectively.
rocprofv3 even provides built-in Kokkos profiling support via the --kokkos-trace flag; the user doesn’t need to compile Kokkos Tools and load the roctx connector.
In our example, the analysis clearly shows how rocBLAS leverages hardware-specific features (MFMA instructions and LDS) to achieve dramatic performance improvements over naive implementations.
These tools continue to evolve, with AMD working to unify the profiling experience similar to NVIDIA’s Nsight ecosystem. As the ROCm platform matures, expect even more sophisticated analysis capabilities for optimizing HPC applications on AMD GPUs.